Hi - Dave here.
Happy New Year!
A while back, I got from a reader about investing for his grandkids:
I hope you can assist me with an Excel calculation. I am keen to show my grandchildren the power of compound interest and the value of investing (patiently) for the long term. And I want to graph this table of annual returns to demonstrate the effect of compounding.
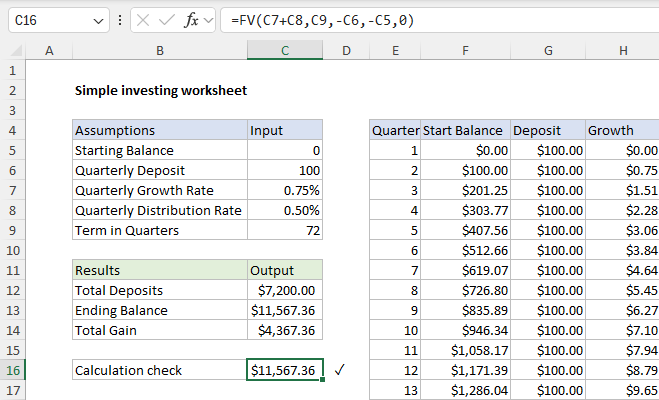
I have started an investment program and have invested $100 per quarter for each grandchild for several years. I want to give each of them the benefits of investing $100 per quarter over 18 years, assuming an investment return of 3% per annum (or 0.75% per quarter) capital growth plus the reinvestment of distributions paid quarterly. I will assume distributions are 2% per annum (or 0.5% per quarter)
This is a great question! Everyone knows Excel can solve this problem, but most people have no experience setting things up. Let's do it!
[
Download the workbook and read the full explanation]
This article explains how to build a model in Excel to show how money grows with compound interest and regular investing. The example is based on investing $100 quarterly for 18 years, assuming an annual return of 3% plus the reinvestment of distributions paid quarterly. It includes step-by-step instructions so you can learn how to build this worksheet yourself, plus the final Excel workbook.
Excel formulas
We maintain a list of over 1000 working formulas
here.
If you need more structure, we also offer
video training.
Have a great weekend!
Dave
The Exceljet newsletter is free and sent weekly on Fridays. I write mostly about useful Excel formulas. You can sign up on our home page.