Hi - Dave here.
Happy Friday!
Weather stations collect a lot of data!
Summarizing this data in Excel can be tricky because there might be tens of thousands of rows.
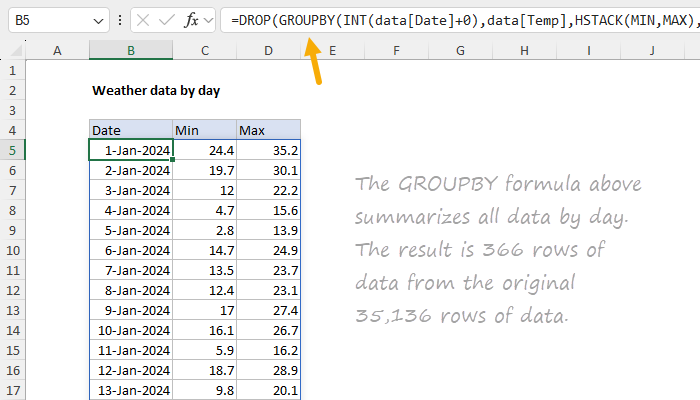
In this example, the goal is to summarize a year of granular weather station readings (about 35,000 rows, one every 15 minutes) for Chicago, Illinois, into a daily summary, then a monthly summary.
The worksheet below shows what the monthly summary looks like. The entire table is generated with a single formula in cell B5.
[
Download the workbook and read the full explanation]
This is a surprisingly challenging problem in Excel, and the formulas are complex. But it's also a nice example of how Excel's new dynamic array formulas can be used to solve hard problems in an elegant way. Read the article for a full explanation and download the workbook to follow along. There are a few useful tricks along the way.
Note: This example requires Excel 365.
Excel formulas
We maintain a list of over 1000 working formulas
here.
If you need more structure, we also offer
video training.
Have a great weekend!
Dave
The Exceljet newsletter is free and sent weekly on Fridays. Each week, I take a detailed look at a specific Excel formula or function. Sign up on our home page.