Hi - Dave here.
Happy Friday!
Have you heard of the 4% retirement rule?
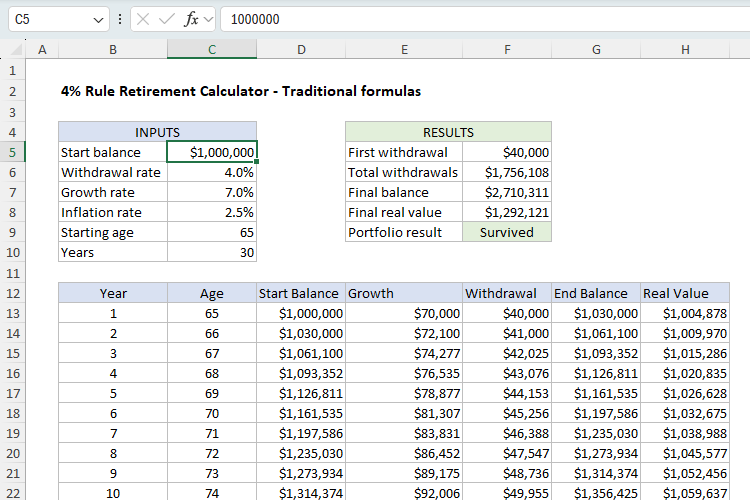
The 4% retirement rule says you can safely withdraw 4% of your retirement savings the first year of retirement, then adjust that amount for inflation each year for 30 years without running out of money.
But how does this actually play out year by year? To find out, I created an Excel model. Actually, I didn't make just one model, I made three 🙂
The screen below shows the basic layout. The key inputs are in the range C5:C10. These are the variables that control the outputs, which include a 30-year withdrawal schedule.
[ Download the workbook and read the full explanation]
The article explores three approaches to modeling the problem in Excel:
- Sheet1 - a classic row-by-row set of traditional formulas.
- Sheet2 - a hybrid approach with one dynamic array formula for each column in the table.
- Sheet3 - an advanced approach that creates the entire withdrawal schedule with a single formula like this:
=LET(
start,C5, wr,C6, gr,C7, ir,C8, age,C9, n,C10,
yrs,SEQUENCE(n),
ages,SEQUENCE(n,1,age),
wds,FV(ir,yrs-1,0,-start*wr),
ends,SCAN(start, wds, LAMBDA(bal,wd, bal*(1+gr)-wd)),
starts,VSTACK(start,DROP(ends,-1)),
growth,starts*gr,
real,PV(ir,yrs,0,-ends),
HSTACK(yrs,ages,starts,growth,wds,ends,real)
)
Each model is fully functional, so you can play with the inputs and see how they affect the outputs. The article above includes a detailed explanation of each approach and the Excel workbook that you can download and try out yourself. Which approach do you prefer?
Note: The traditional formulas on Sheet1 will work in any version of Excel. The dynamic array formulas on Sheet2 and Sheet3 require a modern version of Excel.
Excel formulas
We maintain a list of over 1000 working formulas here.
If you need more structure, we also offer video training.
Have a great weekend!
Dave
The Exceljet newsletter is free and sent weekly on Fridays. Each week, I take a detailed look at a specific Excel formula or function. Sign up on our home page. |