Hi - Dave here.
Happy Friday!
Sorry for the long delay between emails! Lisa and I have been traveling...
I was updating our page on the STOCKHISTORY function recently and wanted to mention that I've finally created a workbook with many examples.
The STOCKHISTORY function was introduced in Excel a few years ago and has one primary purpose: to retrieve historical stock price information to Excel.
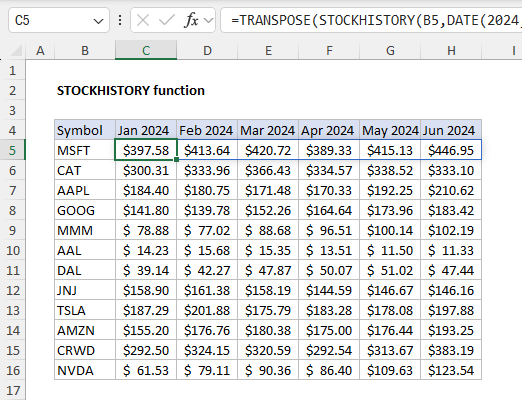
It's a pretty cool function that lets you get daily, weekly, and monthly stock price information into Excel. For example, the worksheet below shows how STOCKHISTORY can be configured to retrieve the monthly closing price for a random collection of US stocks for the first 6 months of 2024. The full formula in cell C5, copied down, is:
=TRANSPOSE(STOCKHISTORY(B5,DATE(2024,1,1),DATE(2024,6,1),2,0,1))
When the formula is entered, the STOCKHISTORY function will return 6 months of stock pricing history for the symbol in B5.
[
Download the workbook and read the full explanation]
STOCKHISTORY can also be used to get historical currency exchange rates. The workbook at the link above contains 8 different examples of how can use the STOCKHISTORY function. Have a look and try it out yourself.
Note: STOCKHISTORY is only available for now in Excel 365. In an older version of Excel, you will see the results, but you won't be able to retrieve new information.
Excel formulas
We maintain a list of over 500 working formulas
here.
If you need more structure, we also offer
video training.
Have a great weekend!
Dave
The Exceljet newsletter is free and sent weekly on Fridays. Each week, I take a detailed look at one useful Excel formula. You can sign up on our home page.