Hi - Dave here.
Happy Friday!
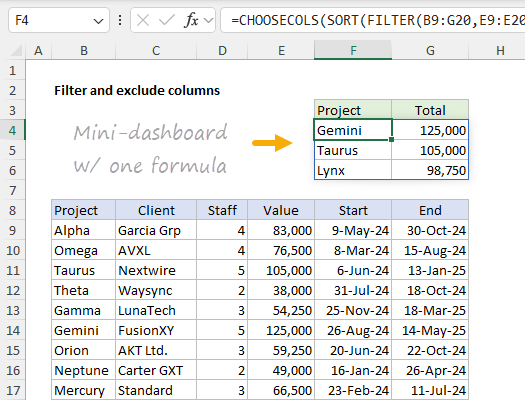
One of the coolest things about the new functions in Excel is how easily you can build a mini-dashboard report with a single formula.
For example, in the worksheet below, the goal is to display projects over 90,000, sorted by value in descending order. In addition, we
only want the name of the project and the value. This is all done with this formula in cell F4:
=CHOOSECOLS(SORT(FILTER(B9:G20,E9:E20>90000),4,-1),1,4)
The beauty of this approach is that the source data remains untouched and can be updated or replaced at any time. Plus, because we are using a formula, any updates will appear
instantly.
[
Download the workbook and read the full explanation]
Excel has been changing very quickly in the last few years and it's easier than ever to do things like filter, sort, and transform data with simple formulas. FILTER, in particular, is a powerhouse function that can solve many hard problems. This example also shows how the newer CHOOSECOLS function can be used to simplify data. I've also included an even simpler formula based on the TAKE function. Combined with the SORT function, TAKE is an excellent tool for creating lists like "Top 3 projects", "Top 5 salespeople", etc.
Note: this example requires Excel 365. However, I've also included a Pivot Table solution on Sheet 3, which will work in any version of Excel.
Excel formulas
We maintain a list of over 500 working formulas
here.
If you need more structure, we also offer
video training.
Have a great weekend!
Dave